1. 2. 3. Report!
Learn a simple audience-centered reporting strategy.
This course is only available to participants who enroll in at least one my premium workshops.
- Do you find report design a little overwhelming these days?
- Does it feel like everyone is asking for shorter, visual reports?
- Do you worry that the short report is not long enough to properly share your findings?
1. 2. 3. Report! is a simple audience-centered strategy designed to make your life as a report creator easier. This course is short but the strategy is at the heart of all of my professional design work.
Reporting does not have to be hard or annoying.
What you will learn.
- The modern 1:3:25 reporting standard and why it's not really about the page numbers.
- A 3 bucket audience approach to choosing the right report types to create.
- My reverse report design process that can make creating contemporary visual reports easier and faster.
You will also get access to 4 activities.
- Designing a 25 Pager
- Designing a 3 Pager
- Designing a 1 Pager
Your Instructor

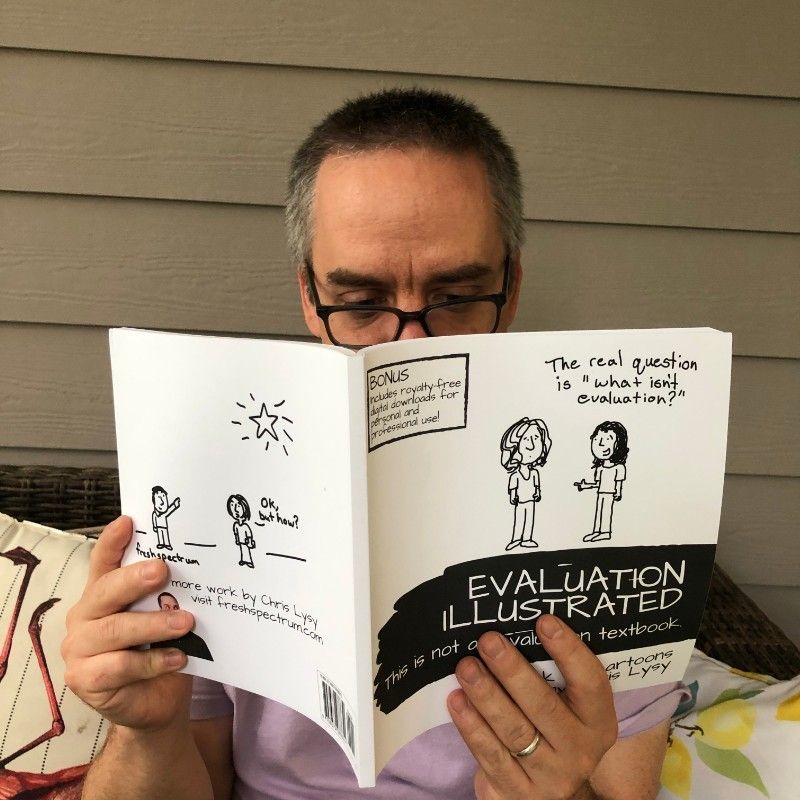
Chris Lysy is a professional data visualization designer with over two decades of experience in social science research, program evaluation, and information design.
Through his blog, books, consulting, and live workshops he has helped thousands of data folk design better reports, infographics, and data dashboards. His goal in teaching is to make sharing data easier, more effective, and way more fun. You can read more about his ideas and work through his blog at freshspectrum.com.
